Accumulating vs. Distributing ETFs: How to Choose for CTO, PEA, PER & Life Insurance

Two-thirds of ETFs (exchange-traded funds) are accumulating, compared to only one-third distributing ETFs (justETF). Why such a difference?
Accumulating and distributing ETFs allow you to invest in the stock market with low fees. In practice, when investing in an ETF, you can choose between two options (distribution policies defined by the management company):
- Distributing ETF: pays out dividends from stocks or interest from bonds directly to investors.
- Accumulating ETF: automatically reinvests dividends or interest within the fund (what is the difference between stocks and bonds?).
You can invest in accumulating or distributing ETFs (the content) within tax-advantaged accounts (the containers) where taxation only occurs upon withdrawal.
The choice between a distributing or accumulating ETF is not crucial in tax-advantaged accounts (outside a standard brokerage account, CTO) such as life insurance, equity savings plans (PEA), or retirement savings plans (PER).
However, in a CTO (non-tax-advantaged account), it is beneficial to opt for accumulating ETFs to:
- maximize compound interest (interest on interest) thanks to more favorable taxation;
- avoid annual tax reporting (ideal for passive management);
- control your income (sell shares as needed, without being subject to a fixed dividend schedule).
[[cta-nl]]
Accumulating vs. Distributing ETFs in a CTO: Comparison Table
Here is a comparison table showing that, in a CTO, it is generally more advantageous to invest in accumulating ETFs than distributing ETFs.
Advantages of Accumulating ETFs in a CTO
In a CTO, investing in an accumulating ETF is more relevant than a distributing ETF because:
- More favorable taxation: deferred taxation, no frictions, reduced tax on foreign dividends, better taxable base;
- Greater flexibility: you control when to receive income;
- Simplified tax reporting: no annual declaration required;
- Passive investment: automatic reinvestment of dividends.
Note: In tax-advantaged accounts (life insurance, PEA, PER), the choice between accumulating and distributing ETFs has no decisive fiscal impact. However, choosing an accumulating ETF provides greater flexibility and supports a truly passive investment strategy.
[[cta-discover]]
What is an Accumulating ETF (Acc)?
An accumulating ETF is designed for a single purpose: pure capital growth.
Mechanism: When an ETF holds hundreds of stocks (e.g., MSCI World), it receives dividends paid by these companies (Total, Apple, LVMH, etc.). In an accumulating fund, the management company (Amundi, Lyxor, iShares...) does not pay this money to you. Instead, it automatically reinvests it within the fund to purchase more shares.
Result: The value of your ETF share increases mechanically, not only due to stock price growth but also through dividend reinvestment. This is the most powerful engine of long-term investing: compound interest. Dividends you never touched generate further gains, creating a snowball effect that accelerates over time.
It’s a 100% passive strategy, ideal if your investment horizon is long and you are in the wealth accumulation phase.
What is a Distributing ETF (Dist)?
A distributing ETF takes a different approach. It is designed to provide you with a regular income stream.
Mechanism: The ETF receives the same dividends as its accumulating counterpart. But instead of reinvesting them, the management company distributes them directly to you. These payments (or "distributions") occur at a defined frequency: quarterly, semi-annually, or annually.
Result: You receive passive income in cash. The dividend is paid into a different account depending on the investment container:
- PEA and CTO: your cash account;
- Life insurance: either in the euro fund or in the same distributing ETF (depending on the insurer).
Therefore, the value of your ETF share only benefits from the price changes of the underlying stocks.
Accumulating or Distributing ETF: How to Know?
The distribution type (accumulating or distributing) is included in the ETF name. Example: Amundi MSCI World SRI Climate Paris Aligned UCITS ETF Acc.
This ETF has a distributing counterpart: Amundi MSCI World SRI Climate Paris Aligned UCITS ETF Dist (IE000004V778), with annual distribution.
How is the Performance of an Accumulating or Distributing ETF Calculated?
ETF performance depends on two factors:
- Price changes;
- Potential dividends (dividend yield).
Example: The annualized performance (2012–2025) of the World SRI ETF reaches 12.5% (source: MSCI World SRI Filtered PAB). Dividends account for about 1.5%, while stock price growth explains the remaining 11% (12.5% – 1.5%).
Why Does a Stock Price Go Up or Down?
Price changes reflect supply and demand. Buying and selling of ETF shares mainly occurs in the secondary market with a generally stable share supply. More demand → higher price; less demand → lower price.
What is a Dividend?
Owning a stock entitles you to a dividend (share of profit, distributed or not each year).
- A dividend is decided at the general meeting and paid per share held.
- Globally, around two-thirds of companies pay dividends (S&P Dow Jones Indices).
- Factors influencing dividends:
- Maturity: Young companies may prefer growth over paying dividends;
- Sector: Tech companies (climate tech) like Tesla often do not pay dividends;
- Corporate culture: Berkshire Hathaway (Warren Buffett) does not pay dividends;
- Geography: Europe pays more dividends on average than Asia or North America.
Are Dividends “Free”?
Contrary to popular belief, dividends are not free money. On the ex-dividend date, the stock price theoretically drops by the dividend amount.
Example: A company worth €100 detaches a €5 dividend → price adjusts to €95.
Management companies typically consolidate portfolio dividends and pay them 1–4 times per year.
In all cases, investors benefit from dividends; only the distribution policy differs:
- Accumulating ETF: reinvests dividends;
- Distributing ETF: pays dividends to investors.
[[cta-platform]]
Best PEA, PER, CTO, and Life Insurance for Investing in Distributing ETFs
Here is a comparison table showing the best life insurance policies, PER contracts, and PEA accounts (tax-advantaged), as well as the best CTO (non-tax-advantaged) for investing in a distributing ETF.
Which PEA, PER, CTO, and Life Insurance Should You Choose?
Each account type (PEA, PER, CTO, life insurance) follows the same regulations (tax-advantaged or not, tax benefits during life and death, investment limits).
In practice, the best accounts offer additional advantages compared to standard bank accounts (BNP, Crédit Mutuel, Banque Populaire, LCL, etc.):
- Lower management fees;
- Wide choice of ETFs;
- Reduced purchase fees and sometimes free scheduled investments.
Note: The choice of account depends on your situation and goals. For example, the PEA is the most advantageous for stock market investing during your lifetime, but it is less suitable for wealth transfer (no tax benefits on death, donations, or usufruct).
Real-Life Investment Example: Accumulating vs. Distributing ETF via a CTO
Investing in the same ETF, accumulating or distributing, via a CTO: how does it affect your capital?
Scenario: Charles invests €500 per month using DCA for 8 years (minimum long-term horizon for an equity ETF).
He considers the sustainable finance ETF Amundi MSCI World SRI Climate Paris Aligned (“green World ETF”), hesitating between the accumulating share (IE000Y77LGG9) and the distributing share (IE000004V778).
Assumptions:
- No purchase fees (scheduled investment via Trade Republic, best CTO);
- Full withdrawal at the end of year 8;
- Charles’ marginal tax rate: 30% → flat tax (30%) applies on capital gains, and on dividends for the distributing ETF;
- Performances are as presented above, with annual dividend distribution.
Comparison Table
Total invested / received
- €48,000 (500 × 96 months)
- €48,000
- €4,567 (sum of dividends received)
Total gains
- €33,263 (81,263 – 48,000)
- €27,253 (75,253 – 48,000)
- €4,567
Flat tax (30%)
- -€9,979 (30% × 33,263)
- -€8,176 (30% × 27,253)
- -€1,370 (30% × 4,567)
Net capital after tax
- €71,284 (81,263 – 9,979)
- €67,077 (75,253 – 8,176)
- €3,197 (4,567 – 1,370)
Net capital per option
- Option 1 (Accumulating ETF): €71,284
- Option 2 (Distributing ETF): €70,274 = €67,077 + €3,197
Net IRR per option
- Option 1: 11.05%
- Option 2: 10.66%
Simulation Result
In a CTO, the accumulating ETF (option 1) outperforms the distributing ETF (option 2) by approximately €1,010 after 8 years for the same ETF: 71,284 – 70,274.
Moreover, the net IRR is 11.05% (accumulating) vs. 10.66% (distributing).
Why? Compound interest is slowed down in distributing ETFs because dividends (1.5%) are not reinvested. In a CTO, dividends are taxed immediately (no deferral), creating a tax friction.
Compounding with Homaio Carbon Allowances
Thus, in a CTO, to maximize financial performance, it is advisable to invest in accumulating ETFs rather than distributing ones.
In tax-advantaged accounts (PEA, PER, life insurance), the choice between accumulating and distributing is less important.
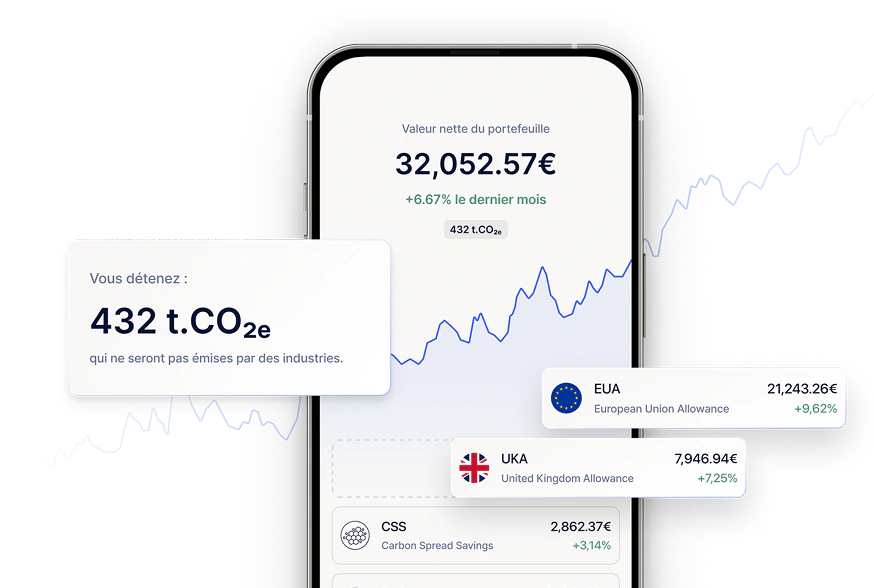
At Homaio, carbon allowances are treated like accumulating assets. These are bonds backed by European emission allowances (EUAs), without coupon payments. Each bond removes one ton of CO₂ from the market and is accessible directly (tax treatment similar to a CTO).
[[cta-simulateur]]
For a global wealth strategy, you can invest up to 10% of your portfolio in carbon allowances. Depending on your life goals and risk profile, the rest can be allocated to:
- A % in fixed income products (bond ETFs, euro funds);
- B % in equities (equity ETFs);
- C % in real estate (REITs / SCPI);
- D % in exotic assets (carbon allowances, gold, cryptocurrencies, etc.).
FAQ
How are dividends from distributing ETFs managed?
Depends on the account:
- Life insurance and PER (tax-advantaged): dividends reinvested in the same ETF or euro fund;
- CTO (non-tax-advantaged) and PEA (tax-advantaged): dividends paid into cash account.
Should I buy accumulating or distributing ETFs?
For a CTO, accumulating ETFs are recommended.
What is the tax impact of choosing accumulating vs. distributing ETFs?
Depends on the account type. In a CTO, distributing ETFs are immediately taxed, and annual tax reporting is required.