UKAs and EUAs: Why Hold Both When You're Already Invested in European Carbon

Correlated at 80%, independent at 20%
Over the last five years, UKAs and EUAs have shown a correlation of around 0.8 on monthly price moves. That means 80% of moves are common: when EUA goes up, UKA generally goes up. When EUA goes down, UKA tends to follow.
That makes sense: two markets covering similar sectors, with the same Cap and Trade mechanic, in economically integrated geographies. A European recession weighs on industrial demand on both sides of the Channel. A heatwave that drives up power consumption pushes prices in the same direction.
But 20% of moves are not common. And those are exactly what makes UKAs interesting for an investor already exposed to EUAs. Three main sources of divergence:
Divergence source #1: the political calendar
The two markets respond to different political agendas.
The EU ETS follows the European Commission's calendar: "Fit for 55" packages, Phase 4 reform, linear Cap adjustment, progressive integration of new sectors (maritime since 2024, ETS2 on road transport and buildings coming next).
The UK ETS, on the other hand, follows the UK government's calendar and that of the Climate Change Committee (CCC), the independent body that advises the UK on its Net Zero trajectory. The CCC publishes "Carbon Budgets" (the 7th was released in February 2025, with a cost-benefit update in March 2026) that drive the UK ETS Cap trajectory.
Investor takeaway: a UK political event (change of government, Treasury announcement, CCC recommendation) can move UKA without moving EUA. And vice versa. That's what creates the idiosyncratic political risk premium that today's UKA market is paying out.
Divergence source #2: industrial structure
The two markets don't cover exactly the same emitters.
UK side: an energy mix with a large share of gas-fired power generation, a heavy industry footprint smaller than Germany's or Poland's, but aviation (Heathrow, Gatwick, Manchester) that weighs heavily in the compliance pool.
EU side: a much more diversified mix, dominated by German, Polish, Italian heavy industry, with coal still present (declining) and stronger exposure to steelmaking than the UK.
Investor takeaway: UKA is more sensitive to gas prices and air traffic; EUA is more sensitive to continental heavy industry and coal prices. Over 12-24 months, these sensitivities create real lags between the two markets.
Divergence source #3: liquidity and microstructure
The EUA market is significantly deeper than the UKA market in trading volumes. EUAs trade on EEX, ICE Endex and several OTC venues, with near-permanent liquidity.
The UKA market is more concentrated on ICE Futures Europe, with more modest daily volumes. That has two consequences:
- Slightly higher volatility on UKA, particularly around major auctions and political announcements.
- The impact of a given buy or sell order is disproportionately larger on UKA prices compared to EUA prices. This amplification effect can result in short-term overreactions, which is valuable information for optimizing entry timing.
Investor takeaway: UKA's lighter liquidity is both a risk (more volatility) and an opportunity (better entry windows for the patient).
Why hold both: the "core + satellite" case
For an investor already positioned on EUAs, adding UKAs follows a "core + satellite" portfolio logic.
The EUA core brings:
- Broad and liquid exposure to the European carbon price,
- A clearly framed trajectory under the European Commission,
- An asset now well-embedded in ESG benchmarks and institutional portfolios.
The UKA satellite brings:
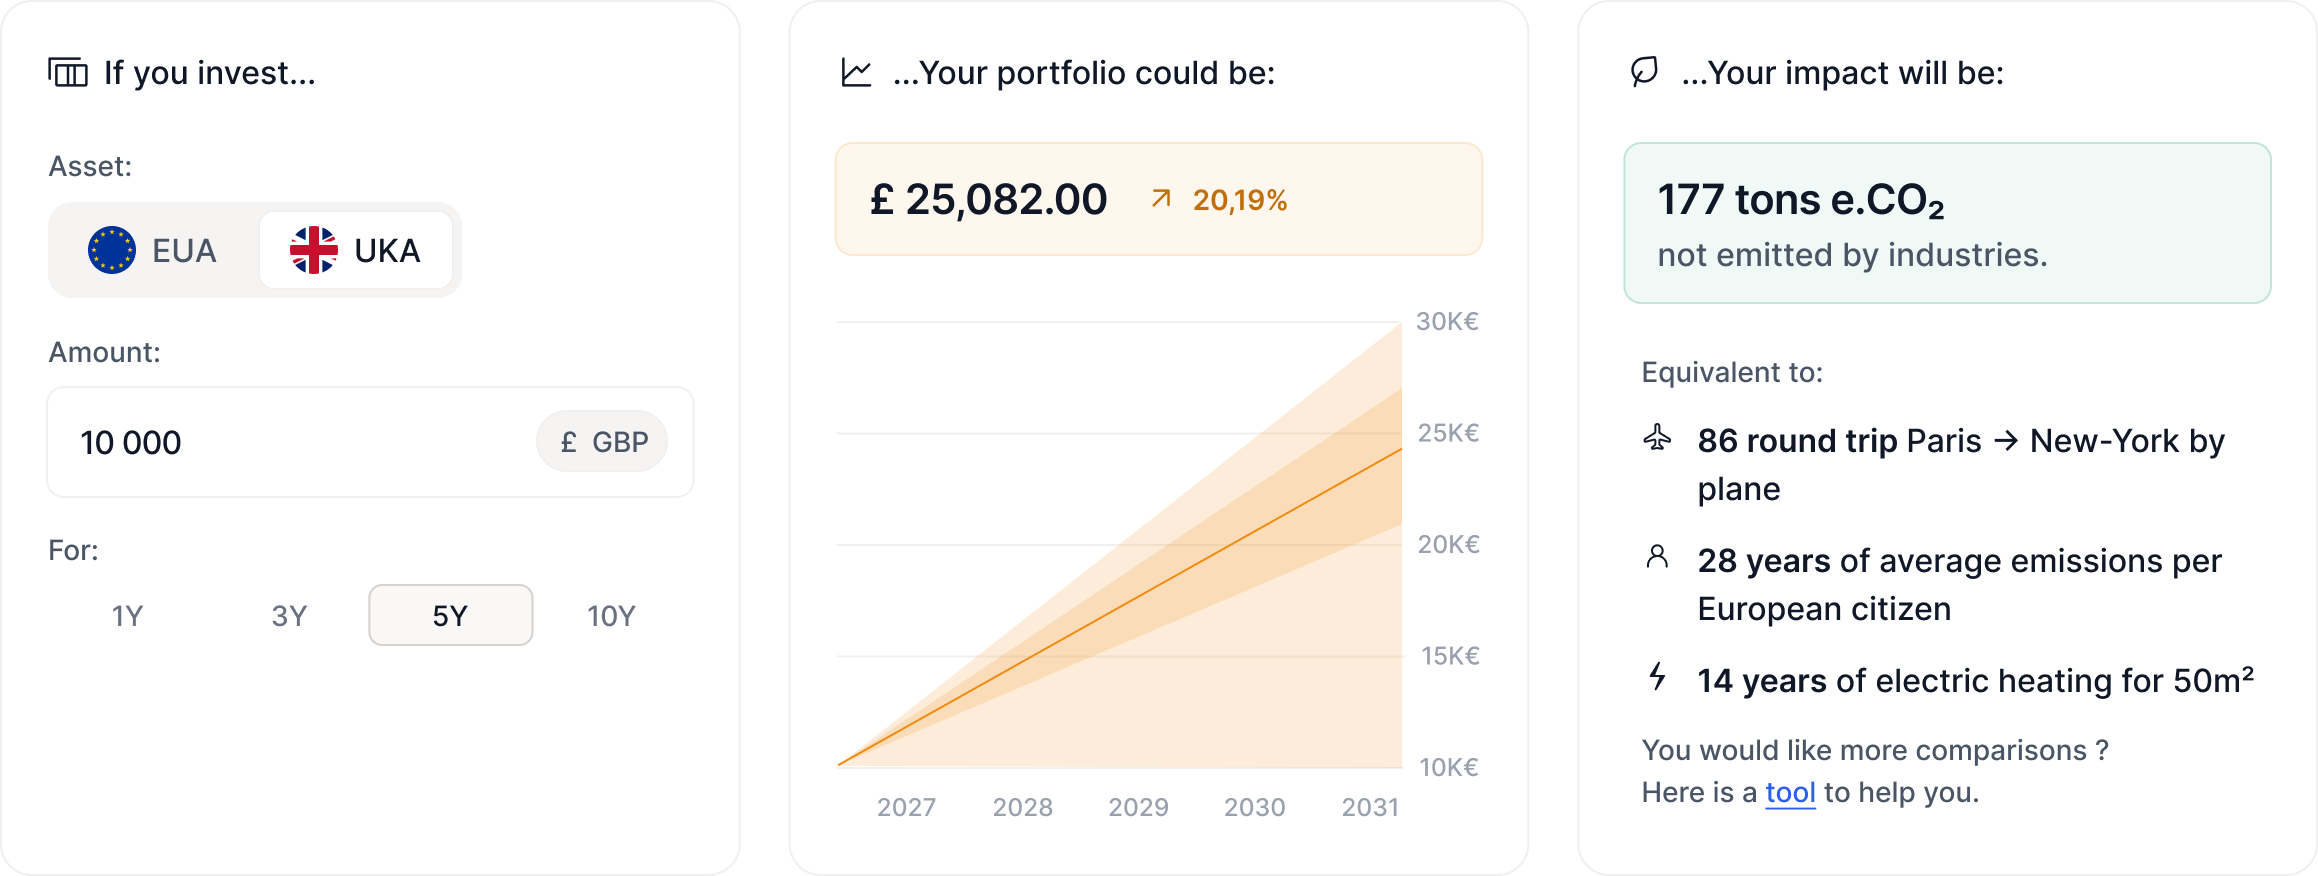
- Exposure to the Convergence Play (residual catch-up potential of around +20%),
- An idiosyncratic political risk premium paid out in today's discount,
- Factor diversification (different sensitivities to gas, aviation, the UK political cycle).
It's the equivalent, in equity land, of pairing an S&P 500 ETF (core, broad, liquid) with a tactical exposure to a specific sector or geography (satellite, more volatile, with potential alpha).
Practically, what allocation?
There's no absolute rule, but some markers help.
For a dedicated "carbon" portfolio, a 70% EUA / 30% UKA allocation offers a sound balance between a stable, liquid core (EUA) and a satellite with stronger catch-up potential (UKA). This split captures the bulk of the Convergence Play while preserving the robustness of the European market.
For an investor who wants to maximise Convergence Play exposure, a more aggressive split (50/50, or majority-UKA) is conceivable, provided the investor accepts higher volatility and a long holding horizon (3-5 years).
These figures aren't recommendations: every investor adjusts to their risk profile, horizon and convictions. But they give an intuition for what "hold both" actually means.
The scenario where UKAs really decouple
Beyond the structural dynamics, there's a strong-decoupling scenario that makes joint holding even more relevant.
Imagine UK-EU linkage takes longer than expected (beyond 2030), the UK government pivots on the Net Zero agenda, and the UK CBAM is delayed. In that case, UKA may stay on its own trajectory, disconnected from EUA for several years. The catch-up is pushed out.
For an investor 100% in EUAs, that divergence is invisible: they don't capture the eventual premium when linkage finally happens. For a 70/30 or 50/50 investor, diversification does its job: the EUA part keeps playing its stable-core role, the UKA part rewards patience.
The takeaway
UKAs and EUAs are fundamentally correlated yet distinct assets. 80% of their moves come from a shared market logic. The remaining 20% (political, industrial, structural) is where the diversification opportunity sits.
For investors already holding EUAs, adding UKAs is not a matter of doubling down; it expands exposure to a dimension of the carbon market not fully captured by EUAs alone. Furthermore, in the current market, it allows investors to capitalize on the Convergence Play: a macro-political trade that offers a residual mechanical upside of approximately +20%.
European carbon is a portfolio core worth complementing, not a closed universe. UKAs are exactly the complement that turns a "carbon" exposure into a diversified, opportunistic carbon exposure.